This document explains how to view both online and offline histograms
using the following methods:
Online histograms are viewed using Roody. Roody is an online/offline
histogram viewer originally developed by the 8Pi group but now
rewritten by the TRIUMF MIDAS group for general use. It is
automatically started by the DAQ start script (see Starting the MIDAS data-acquistion system
on isdaq04).
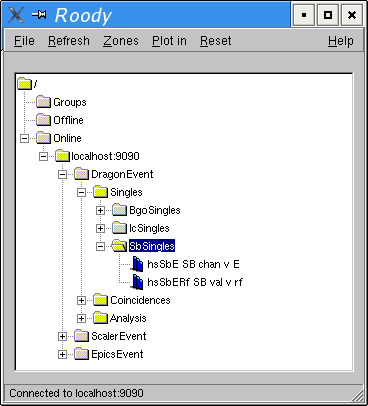
To view histograms from the current run online, simply click on
"online" folder in Roody window.
However, if for some reason, Roody is not connected online or online
histograms from another machine are to be viewed, then Roody must be
reconnected to the online server. To do this:
- Start Roody using the histogram icon or typing in a terminal:
[dragon@isdaq04]~>> roody
- Click the "File" pop-up menu item.
- Select "Open online".
- Enter "isdaq04.triumf.ca:9090" and press "OK".
- Histograms located in the folders should now be viewable.
Notes:
- It is not necessary to log on to isdaq04 and run a copy of Roody
there. Having Roody on a local machine is sufficient to view online
histograms through a network connection.
- The online analyzer must be running for the connection to be made
to the server to retreive the histograms for viewing. If this is not
running there is NO WAY online histograms can be viewed.
- If you're really desparate, it is possible to use the HV
calibration program to view online histograms, but I'm not going to
explain how to do that here...
Using Roody:
On isdaq04, Roody is automatically started by the DAQ start script.
If it is not running, it must be started.
- Start Roody using the histogram icon or typing in a terminal:
[dragon@isdaq04]~>> roody
- Click the "File" pop-up menu item.
- Select "Open data file". The offline file-locator will open:
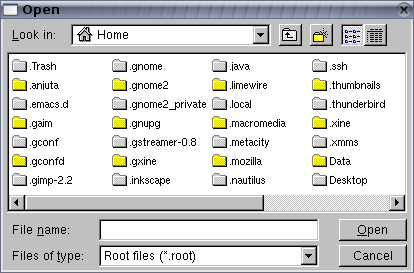
- Navigate to where the files are located and open the the
histogram file (usually named hisXXXXX.root where XXXXX is the
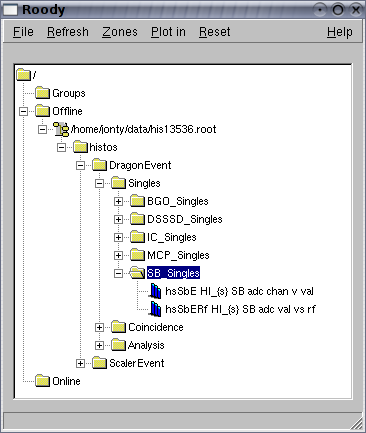
run number). Double click the file, it will open into the
"offline" folder.
- It should now be possible to view the histograms located in the
folders. As many files as desired can be opened using this
method.
Alternative - Using TBroswer:
It is also possible to use ROOTs native TBrowser class to view
histograms.
- Start root by typing in a terminal:
[dragon@isdaq04]~>> root
- Open a browser window:
root [] new TBrowser;
- Within the browser window in the frame labeled "Contents of "." ",
double-click on the directory where the root file is stored.
- In the same frame, double-click on the file name.
- Now navigate to the "ROOT Files" folder in the left window pane.
- Double-click the file, move through the folders to the histograms.
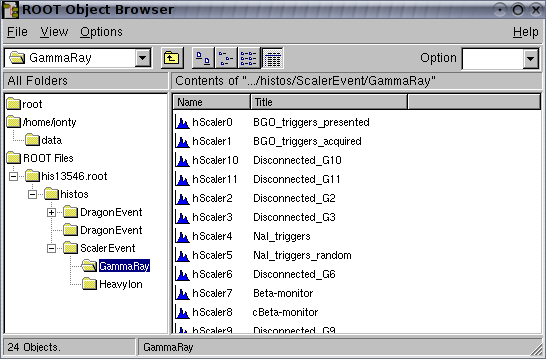
- Double-click a histogram to make it appear in a new window.
- To expand the scale put the cursor on the axis of the plot and a
finger will appear. Hold down the left button and move over the
portion that is wanted displayed to be displayed.
- Select Options/Event Status on the canvas to see the bin values and
contents.
- To change the style of plot (surf, lego, etc.) do the following:
- Right-click on the 2d histogram and select "DrawPanel".
- In the DrawPanel, left-click on desired option.
- In the DrawPanel, left-click on "Draw".
- Right-click different parts of the canvas to bring up many other
options.
- To quit root one can use the appropriate pull down menu from the
browser or type .q at the root prompt in the terminal.
root [] .q
Notes
Finding where the histograms are located can sometimes be
difficult. One easy way to find recent histograms is to look in the
top right corner the MIDAS status page under the "Data dir" heading.
For example, below the histograms are located in
"/data1/dragon/tmp":
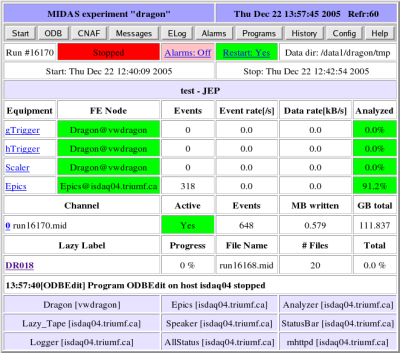
This is only good for histogram files in the current experiment, but
may give clues as to where other histogram files are located.
|
