Using the EPICS control system, magnetic field readings for Q9 and Q10 were taken at evenly spaced intervals of current over the range 10A to 40A. This data is presented in Tables 3 and 4.
Data was taken both in the direction of increasing current and the direction of decreasing current to determine the extent of hysteresis in the quadrupoles. Q9 had no obvious hysteresis, so only readings taken in the direction of increasing current were included in the analysis. Q10 showed slightly more hysteresis than Q9, but not enough to warrant the analysis of two separate sets of data. Thus, only readings taken in the direction of increasing current were analyzed for Q10.
As with MD1 and MD2, data was fit in two separate ways - with the magnetic field as a function
of the setpoint current, and current as a function of the field. These fits are given below:
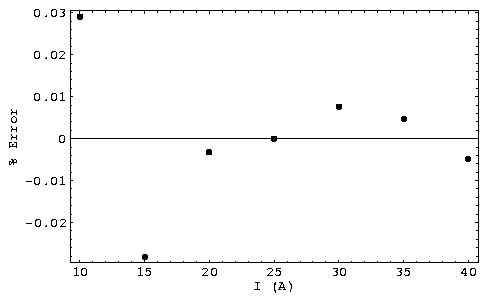
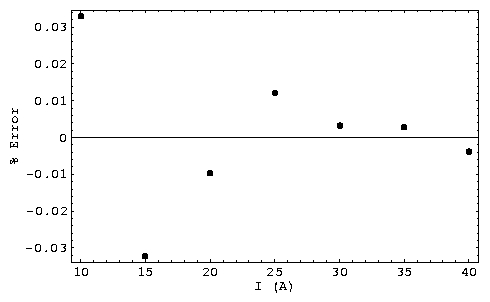
The percentage error in the fits is given in Figures 5 and 6. It was calculated using the same method as that for MD1 and MD2.
In the course of data collection, a curious observation was made relating to the Hall probes located in Q9 and Q10. Initially, readings were made with the Hall probe set at the 2kG level. After all the data had been collected, the level was switched to 20kG. Upon return to the 2kG level, the magnetic field readings were found to be different than those taken before the brief change to 20kG. This disagreement between field readings occurred in both Q9 and Q10. The ``new'' data was less stable than the original readings (the magnetic field readings varied more at a set current), but it deviated less from a quadratic fit (the difference between measured and fitted values were on the order of a hundredth of a percent rather than on the order of a percent, as it was for the ``old'' data). For this reason, this ``new'' data was favoured over the ``old'' data. The cause of this inconsistency in field readings is currently unknown.
|