next up previous
Next: Q9 and Q10 Up: Results Previous: Results

MD1 and MD2

Using the EPICS control system, NMR readings for MD1 and MD2 were taken at evenly space intervals of current over the range 250A to 450A. The range of DAC values for which the NMR would lock onto the field was also determined. This data is presented in Tables 1 and 2. (The NMR DAC value given is the average of its range.)

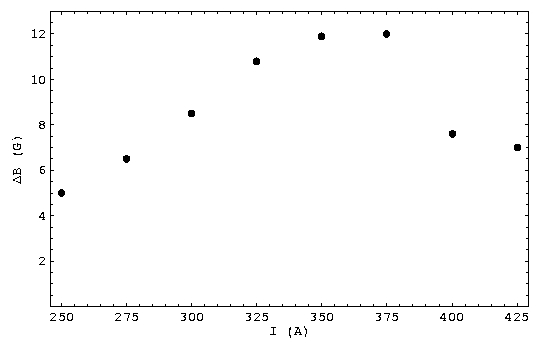
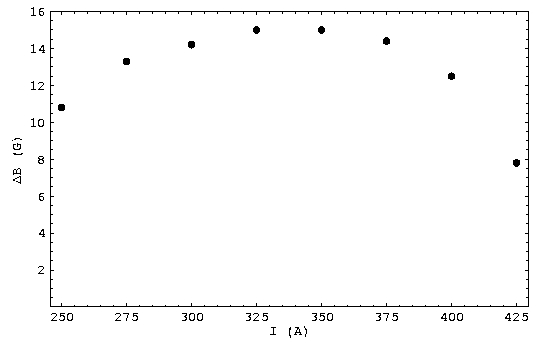
Data was taken both in the direction of increasing current and in the direction of decreasing current to determine the extent of hysteresis in the dipoles. Though small, hysteresis was noticeable, with $\Delta$B as high as 12G for MD1 and 15G for MD2 (see Figures 1 and 2).

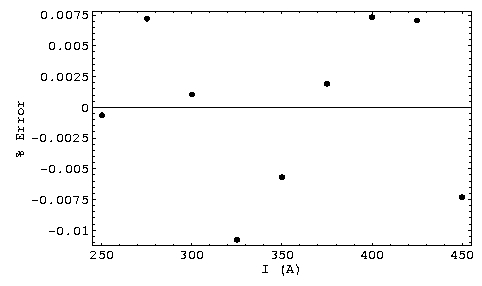
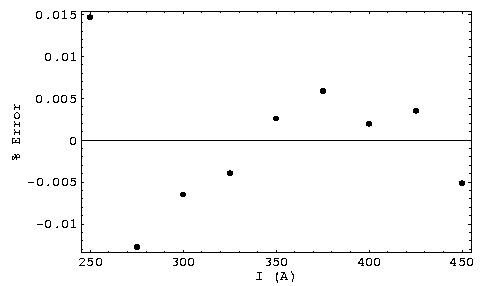
Quadratic fits were calculated for sets of data taken in both the direction of increasing current, and the direction of decreasing current. The fit for the data taken in the direction of increasing current was favoured because it was found to deviate less from the data. The average absolute error for this set of data was 0.005% for MD1 and 0.006% for MD2, as compared to 0.03% and 0.02% for the data taken in the direction of decreasing current (see Figures 3 and 4).

The data was fit in two separate ways - first, the magnetic field was fit as a function of the setpoint current, and then, the current was fit as a function of the field. These fits are given below:

\begin{displaymath}
B_{MD1} = 13.5 + 12.1 I - 0.000433 I^2
\end{displaymath} (1)


\begin{displaymath}
I_{MD1} = -1.01 + 0.0825 B - 2.64\times10^{-7} B^2
\end{displaymath} (2)


\begin{displaymath}
B_{MD2} = -0.983 + 16.8 I - 0.000521 I^2
\end{displaymath} (3)


\begin{displaymath}
I_{MD2} = 0.140 + 0.0595 B + 1.18\times10^{-7} B^2
\end{displaymath} (4)

The percentage error given in Figures 3 and 4 was calculated according to Eq. 5. Absolute error was calculated by taking the absolute value of the difference between the measured and fitted values.

\begin{displaymath}
\% \mbox{ Error} = \frac{(\mbox{Measured Value - Fitted Value})}{\mbox{Measured Value}}
\end{displaymath} (5)


Table 1: MD1 magnetic field as a function of setpoint current.
Current I (A) Field B (Gauss) NMR DAC % Error in Fit
250 3012.7 3.161 -0.001
275 3309.9 3.452 0.007
300 3606.1 3.720 0.001
325 3901.5 3.974 -0.011
350 4197.0 4.258 -0.006
375 4492.1 4.575 0.002
400 4786.6 4.894 0.007
425 5080.3 5.394 0.007
450 5372.7 6.116 -0.007
425 5087.3 5.407 -0.029
400 4794.2 4.916 0.038
375 4504.1 4.584 -0.013
350 4208.9 4.268 0.005
325 3912.3 3.997 -0.021
300 3614.6 3.717 -0.036
275 3316.4 3.458 -0.018
250 3017.7 3.171 0.042


Table 2: MD2 magnetic field as a function of setpoint current.
Current I (A) Field B (Gauss) NMR DAC % Error in Fit
250 4164.4 1.713 0.015
275 4576.1 2.262 -0.013
300 4988.6 2.713 -0.006
325 5400.3 3.065 -0.004
350 5811.6 3.336 0.003
375 6222.1 3.555 0.006
400 6631.5 3.752 0.002
425 7040.6 3.993 0.004
450 7448.3 4.100 -0.005
425 7048.4 3.929 0.017
400 6644.0 3.759 0.025
375 6236.5 3.568 0.015
350 5826.6 3.342 -0.006
325 5415.3 3.078 -0.022
300 5002.8 2.742 -0.026
275 4589.4 2.284 -0.011
250 4175.2 1.726 0.034


Figure 1: Extent of hysteresis in MD1.

Figure 2: Extent of hysteresis in MD2.

Figure 3: Percentage error in fit for data from MD1 taken in the direction of increasing current.

Figure 4: Percentage error in fit for data from MD2 taken in the direction of increasing current.


next up previous
Next: Q9 and Q10 Up: Results Previous: Results
Catherine Neish 2003-03-12