Data for fourteen runs involving a ![]() Na beam taken between 2002
December 1 and 2002 December 8 were assembled from various sources.
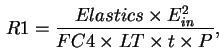
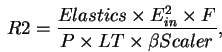
Three different ratios were calculated for each run: elastic
monitor counts to FC4 reading (R1), elastic monitor counts to beta
monitor counts (R2), and beta monitor counts to FC4 reading (R3).
With corrections for Rutherford scattering, the fraction of beam
particles in the selected charge state, the livetime of the device,
and the pressure, these ratios are given by
Na beam taken between 2002
December 1 and 2002 December 8 were assembled from various sources.
Three different ratios were calculated for each run: elastic
monitor counts to FC4 reading (R1), elastic monitor counts to beta
monitor counts (R2), and beta monitor counts to FC4 reading (R3).
With corrections for Rutherford scattering, the fraction of beam
particles in the selected charge state, the livetime of the device,
and the pressure, these ratios are given by
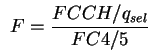
The run number, pressure, incoming energy, and Faraday cup
readings were obtained from the log book. The ratio of the FCCH
reading to the FC4 reading was used to determine the charge state fraction F.
The livetime LT was determined by the ratio of heavy ions acquired to heavy ions presented, as documented in the .odb file. This information was used in the analysis of all ratios of interest.
Depending on the ratio being studied, the elastic monitor rate and beta monitor rate was calculated by one of two separate methods. Since the beam is not stable throughout a run, one could not compare the FC4 reading taken at the beginning of the run to the beta/elastic monitor counts taken over the entirety of the run. Instead, R1 and R3 were calculated by considering only a period at the beginning of the run where the elastic monitor counts were considered to be stable. The counts were obtained by integrating over the specified period of time in the NOVA program.
Since R2 does not depend on the Faraday cup readings, statistics for this ratio were improved by comparing the beta monitor counts to those of the elastic monitor over the entire length of the run. The beta monitor counts were obtained from the .odb file, while the elastic monitor counts were determined by integrating under the elastics spectrum.
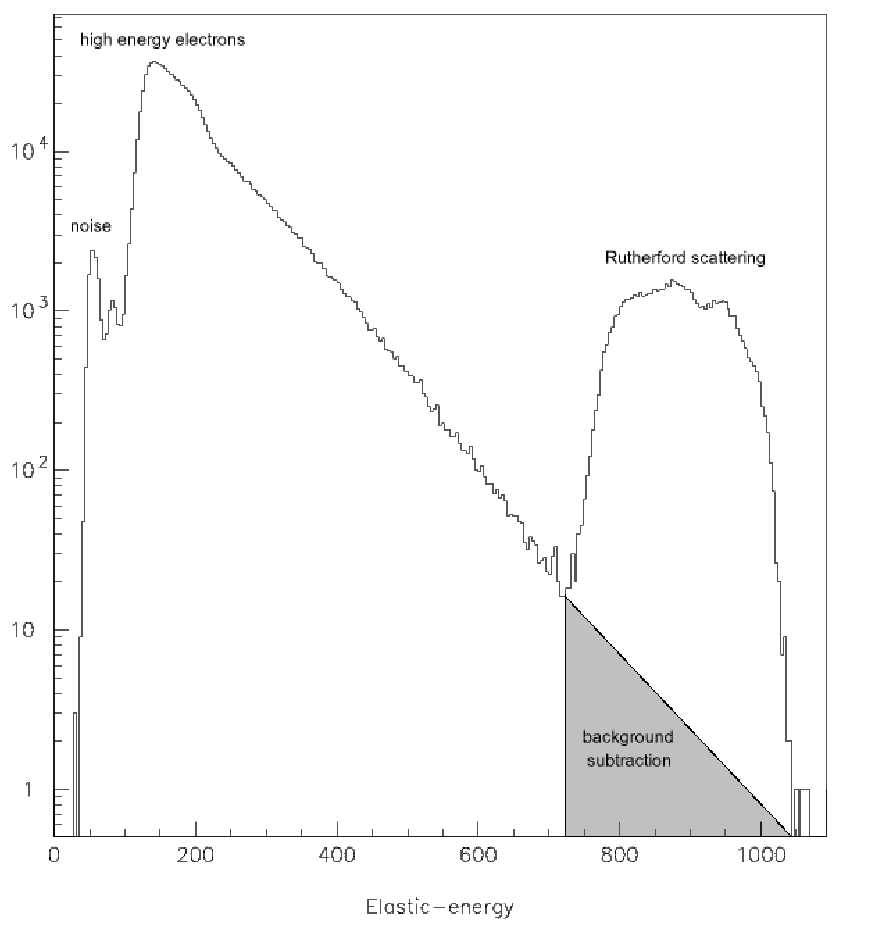
In each method, it was necessary to remove background counts in the
elastic spectrum resulting from ![]() particles produced from the
decay of
particles produced from the
decay of ![]() ions stopped at the gas target. This was done by
extrapolating the background to the energies associated with elastic
scattering events, and subtracting the counts under the extrapolated
curve (Figure 1).
ions stopped at the gas target. This was done by
extrapolating the background to the energies associated with elastic
scattering events, and subtracting the counts under the extrapolated
curve (Figure 1).